|
|
|||||||||||||
|
Bredhurst Receiving and Transmitting Society |
|
||||||||||||
|
|
|||||||||||||
Spectrum Analyser 9A9 56 Understand the purpose and basic operation of a Spectrum Analyer. The purpose of a Spectrum Analyser is to measures the magnitude of an input signal against its frequency within the frequency range, also called the frequency-domain, of the instrument of known and unknown signals.  says "The spectrum analyser is a
cross between a scanning radio ( receiver) and an
oscilloscope". says "The spectrum analyser is a
cross between a scanning radio ( receiver) and an
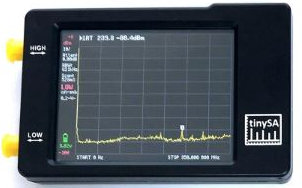
oscilloscope". The primary use Spectrum Analyser is to measure the power of signals on known frequencies and also unknown signals. The Spectrum Analyser can assess the frequencies in relation to their :- power, distortion, bandwidth, and especially their harmonics which are useful characteristics of a wireless transmitters. The display of a spectrum analyzer is similar to that of an Oscilloscope in that the frequency-domain is displayed on the X horizontal axis as the unit sweeps from left to right and the amplitude, or strength, of the signals are displayed on the Y vertical axis using a dB scale. When using a Spectrum Analyser you must know the maximum amplitude of the input signal that the equipment can use. A "tinySA" spectrum analyser as seen below can cope with a maximum of 10dBm which is 10 milli watts of input power. At such a low level an attenuator is required so that you do not ruin the equipment such as a 30dB attenuator.  Using
what you may know about dB calculation here is the easy way to
see what 30dB attenuator will achieve.
Say
we used 10 watts input to the attenuator then what level do we
go down to after the attenuation at the output.
10 watts = 10,000 milli watts So with 10 watt 10,000 milli watts in -3dB gives 5000 milli watts So at -6dB down another 3dB gives 2500 milli watts So at -9dB down another 3dB gives 1250 milli watts So at -12dB down another 3dB gives 626 milli watts So at -15dB down another 3dB gives 312.5 milli watts So at -18dB down another 3dB gives 156.25 milli watts So at -21dB down another 3dB gives 78.125 milli watts So at -24dB down another 3dB gives 39 milli watts So at -27dB down another 3dB gives 19.5 milli watts So at -30dB down another 3dB gives 9.76 milli watts The
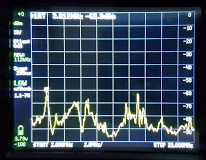
signal to be analysed is connected to one of the inputs on the
left hand side and then a display, such as below, shows the
result.
 More
information on the tinySa can be found here https://www.tinysa.org/wiki/
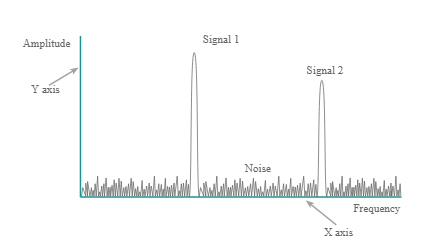
So what does a screen display on a Spectrum Analyser look like as above but less complex as below. Frequencies are lower on the left hand side of the screen and rise as one progresses across to the right hand side.  This
is typical of a display which show Signal 1 which is the the
fundamental frequency and Signal 2 which is the second
harmonics at twice the frequency of the fundamental frequency.
More might well be shown if the width of the display could
accommodate more of the frequencies but in each case next
harmonic would be lower in amplitude.
The
fundamental frequency will be the tallest one in amplitude and
the harmonics will be lower progressively in amplitude as they
go higher in frequency.
|
|||||||||||||
|
|
|||||||||||||
|
|
|||||||||||||
|
|
|||||||||||||


