|
|||||||||||||
|
|
|
||||||||||||
|
|
|||||||||||||
|
Syllabus Sections:- IF amplifier 3I4 26 Understand the operation of an IF amplifier and the IF transformer. Understand
the operation of an IF amplifier and the IF transformer. 3I4
26 continued Understand the
concept of two LC tuned circuits utilising transformer
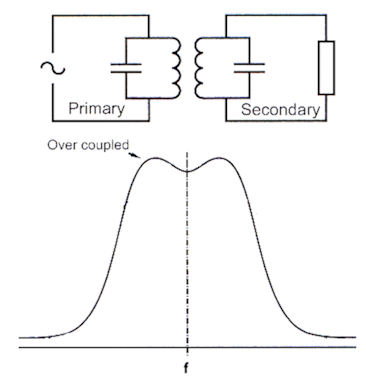
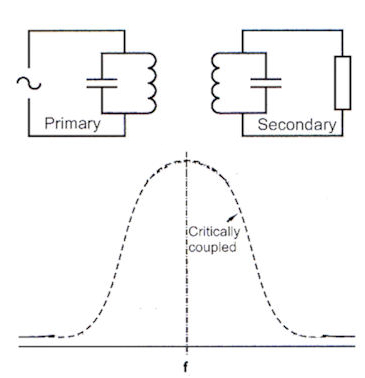
coupling. In the top part of the diagram below you can see two parallel tuned circuits comprising of a coil and capacitor with an AC input signal (remember that a DC signal does work with transformers !!) and a load on the output representing the rest of a circuit. When the two coils are placed relatively close together there is induction between the coils just as in the primary and secondary of a transformer so this is utilising transformer coupling.
When the IF transformers
are made the spacing between the two coils of the parallel
tuned circuits must be adjusted critically. If the coils are
physically too close together we get an over coupling
situation which gives what is commonly known as "double
humping" where there is a dip in the centre of the response
cure as shown in our diagram, which means you have a very wide
response. If you take the coils further apart then you get a wider coupling and this results in a much sharper response curve. Just before the point of over coupling, where the dip becomes noticeable, is the limit to the distance between coils which produces the point of "critical coupling" where the response curve has the steepest sides without the dip in the top.
As you move the coils apart the gain of the stage will reduce as the RF signal has to be coupled between the two. The manufacturer will do their best to provide a good transformer but it might not give you the selectivity you want and you may have to resort to an additional crystal filter.
To remind
you the AGC is a controlling voltage to increase or reduce the
gain of the IF amplifiers hopefully to keep the audio output
in the loud speaker constant. Usually the control trigger for
this is taken from the detector. -------------------------------------------------------------------------------------------------------------------------------------------
3I5 26 Recall the source and effects of phase noise Let's us first understand a few terms. A "frequency-domain" graph shows how much amplitude of a signal lies within each given frequency band over a range of frequencies. The frequency-domain is displayed on a spectrum analyser where the X axis (the horizontal one) represents all the scanned frequencies displayed. In the processing of a wanted signal, Phase Noise is represented in the frequency-domain of a waveform and consists of rapid, short-term, random fluctuations in the phase (or put it another way random fluctuations in the frequency) thus there are changes which detract from the perfect wanted wave form. Therefore on a Spectrum analyser you would see the changes in the slight frequency also know as the random fluctuation which are short term. In analogue amateur radio signals one considers phase noise of an oscillator (changes in frequency), whereas in digital-systems the phase noise is with the jitter (slight changes in the speed) of the control clock. 3I5 26 continued Recall the unit of measurement is dBc/Hz Phase
noise can be measured using a spectrum analyzer where if the
phase noise of the device you are testing is large with
respect to the spectrum analysers local oscillator. Care
should be taken that observed values are due to the measured
signal and not the shape factor of the spectrum analysers
filters.
|
|||||||||||||
|
|
|||||||||||||
|
|
|||||||||||||
|
|
|||||||||||||